
Top Time-saving Tricks for Financial Modeling
Finance is a competitive industry where individuals are critically assessed on their technical and interpersonal skills during recruitment and daily work.

Updated:
April 30, 2023Finance is a competitive industry where individuals are critically assessed on their technical and interpersonal skills during recruitment and daily work. Due to the high demand for finance jobs, professionals in the industry are constantly at risk of being replaced by newcomers.

In finance, no one is indispensable. Therefore, outperforming other candidates is crucial to excelling in the industry. In addition, financial modeling is essential for creating economic forecasts of a company's future performance, which guides planning and strategic decisions.
Financial models accomplish this through assumptions about a company's future financial position, primarily based on variables found in their economic history, such as expenses, revenue, and other key variables that forecast likely future outcomes.
However, one model can only accomplish some things. Financial models focus on different parts of a business, such as budgeting, forecasting, raising capital, company valuation, making acquisitions, measuring outcomes of management decisions, and organic business growth.
Making of Financial Models
The construction of financial models usually happens on Excel spreadsheets by manual entry. For example, the simplest three-statement model only requires a cash-flow statement, balance sheet, and income statement.
Building a basic financial model is easy if you have basic Excel and accounting skills. For your reference, here is an example of a balance sheet.
Balance Sheets
| Balance Sheet | ||
|---|---|---|
| 2015 | 2014 | |
| Assets | ||
| Cash | $ 7,282 | $ 57,600 |
| Accounts receivable | 632,160 | 351,200 |
| Inventories | 1,287,360 | 715,200 |
| Total current assets | $ 1,926,802 | $1,124,000 |
| Gross fixed assets | 1,202,950 | 491,000 |
| Less: accumulated depreciation | 263,160 | 146,200 |
| Net fixed assets | $ 939,790 | $ 344,800 |
| Total Assets | $ 2,866,592 | $1,468,800 |
| Liabilities and equity | ||
| Accounts payable | $ 524,160 | $ 145,600 |
| Accruals | 489,600 | 136,000 |
| Notes payable | 636,808 | 200,000 |
| Total current liabilities | $ 1,650,568 | $ 481,600 |
| Long-term debt | 723,432 | 323,432 |
| Total liabilities | $ 2,374,000 | $ 805,032 |
| Common stock (100,000 shares) | 460,000 | 460,000 |
| Retained earnings | 32,592 | 203,768 |
| Total common equity | $ 1,126,408 | $ 663,768 |
| Total liabilities and equity | $ 1,740,184 | $1,468,800 |
Financial models present numerical information about all or some of the company's operations, and there are many different ways in which economic models can be utilized. For instance, some have more complex purposes of identifying specific business areas.
To explain, financial models are helpful to investors in creating valuations that highlight the performance of a company relative to its industry competitors. It could also help investors secure loans and calculate insurance needs.
Alternatively, industry leaders make quick strategic decisions to achieve business growth, so financial models may help by measuring the possible outcomes of management decisions by analyzing revenue levels to know whether to raise or lower the price of a product.
Common financial models used by companies include:

Good financial models must include the following essentials:
- Follow a clear, easy-to-read structure
- Are accurate and well suited for their purpose
- Follow a standard of color coding and formatting
- Rely on accurate assumptions
- Changing assumptions should automatically change the values in the model.
This guide will focus on how to build Financial Models efficiently to make you a valuable asset to any company. First, covering the basics industry rules of practice for financial modeling is essential to produce efficient quality work.
Best Practices in Financial Modeling
Even though many different financial models exist, general expectations must be upheld when making them for professionals.
The industry expectation is based on color coding, formatting, and the right choice of words that make it easy to interpret the model.
This section will detail the best practices for creating professional-level financial models.

1. Understand the goal of the model and its users
Before starting, if you know an associate will go through your financial models, make it easy for them to understand, and keep it to one document if possible. It will save reading time and avoid user errors.
2. Categorize your variables into sections
3. Follow industry expectations.
Color coding plays a massive part in making variables easier to identify in the model, making it faster for the reader to go through. Use the black font for formulas and numbers, green for links to other worksheets, and red for other files.

4. Consistent number formatting throughout the model
It is fundamental in every financial model. A percentage format and decimal format in the same row would cause much confusion and frustration for the reader. Therefore ensure these points are covered:
- Right-click all the cells with dollar values in your model
- Select "Format Cells," then "accounting" under "numbers."
- If you choose a different formatting option, like "currency," be careful of errors.
5. Ensure the model is readable
Assign each value to only one cell and do not input that value into many other compartments to avoid confusion. In addition, each value should only be in areas appropriate for them in the worksheet.
6. Never add assumptions into formulas.
We initially group our variables into categories so that critical variables in our model do not get lost in formulas or challenging to find cells.
If an assumption is in a formula, it is easy to forget that it is there, which could cause inaccurate results if the model is adjusted.
7. Keep the formulas basic.
One mistake in an excel model can trigger a landslide of inaccuracies in your number values. Therefore, to make it easy for you or the user to keep tabs on each step of the process, break complex formulas into simpler ones.

8. Double, Triple check your model!
Your model will only be as good as your formulas, and your results are only as good as the numbers you use. Therefore, confidently ensure that your procedure is correct in every step and make sure your numbers are accurate.
9. Testing is critical.
The first step of understanding your model becomes essential at the end, too, as testing allows you to understand your model's limitations. So by the end, you should know your model's goal, who will use it, and its limitations.
How to build a financial model fast
To save time in building financial models, the best advice is to practice, practice, practice. Efficiency comes down to how skilled you are at making the model. So start with a basic model.
An introductory income statement that calculates Operating Income and Margins is good for someone learning the ropes of excel, as it requires understanding how to program cells in a way that estimates future performance through assumptions.

Learning financial modeling shortcuts through building simple models leads to an easier time setting up more complex models later on. Altogether, as a beginner, this task should take an hour maximum. As you practice, aim to reduce the time spent on the model to 30 minutes.
Work through these steps and source your values independently to become proficient at building these models. In addition, it will allow you to memorize the process of building. Mastering excel means mastering financial models, improving muscle memory, and knowing shortcuts are key.
Assumptions
The first step is categorizing your variables. Firstly, create a new spreadsheet and label the first row "Assumptions." Label the columns (A, B, C, D, etc.) with the fiscal years you want to project in your model.
Secondly, label rows (1,2,3,4, and so on) with variables relevant to your business, such as Revenue, Units, Price, COGS, Cost of Labor and Cost of Capital, under Operating expenses, etc.
Now, fill in the table! Make realistic assumptions that correspond to your company's variable and fiscal year. Remember that any dollar values in the model should be formatted under the "accounting" option, which automatically converts the matter to a dollars and cents format.
Variables that should be listed as dollar values mentioned in this example include Revenue, Price, Cost of Goods Sold, Cost of Labor, and Cost of Capital. To format these numbers, select "Format Cells," then "accounting" under "numbers."
The result should look like this:
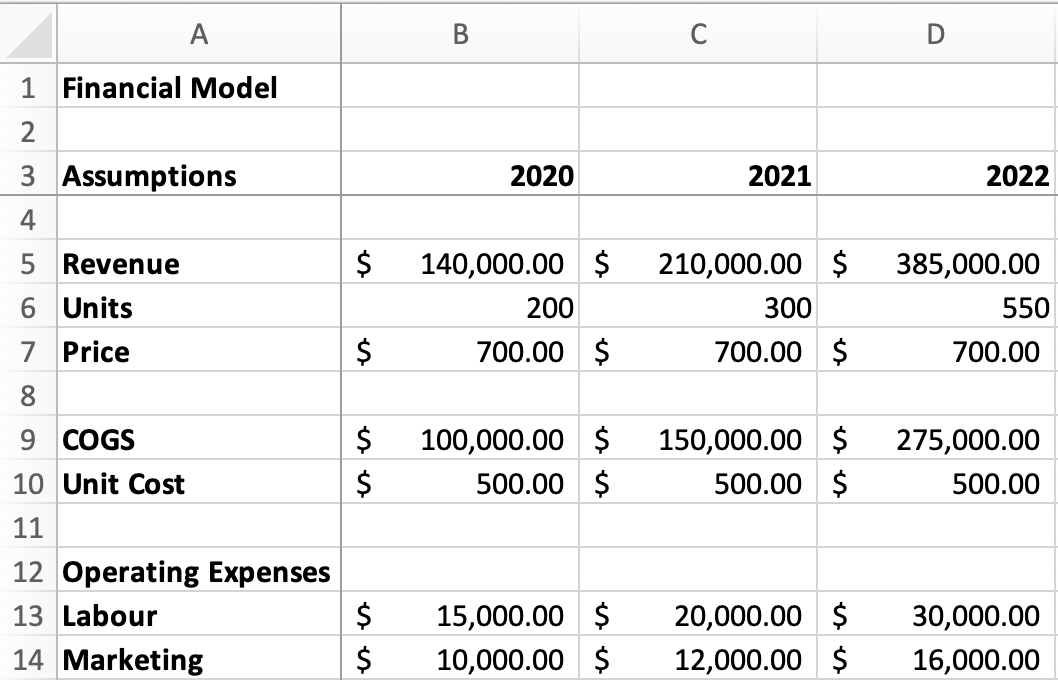
The corresponding rows and columns were also encouraged to distinguish the numbers. Now that we have input values that correspond to our essential variables, the assumptions section of the model is complete.
Now revenue can be calculated, and we can work more on the formatting to make the model easier to follow. First, Highlight cell B4 and select "windows" (on Mac), or "view" (on windows), then select "freeze panes" to lock your labels in place and improve readability.
To specify, this makes your row and column-labeled variables visible when you scroll through the document. Then, if necessary, you can input more values and expand your model without scrolling to the side to see which cells correspond to which titles.

To calculate revenue, we multiply the price by the units sold. We can do this by typing this formula in a cell: =B6*B7, which bears the value in cell B6 with the matter in cell B7. Ensure that the procedures in your worksheet correspond to your respective buys.
Next, drag the cell, or copy and paste this formula to the other empty revenue cells in the column, and excel should automatically correct them to the correct year you are working in. First, double-check if the cells correspond to their row and column.
To calculate the Cost of Goods Sold, multiply "Unit Cost" by "Units" in the same row. It is done through the formula: =B10*B6, which calculates the value of cell B10 with the value of cell B6.
Then drag the cell, or copy and paste this formula to the subsequent empty cells in the column. Lastly, ensure that the "accounting" format is selected for all the relevant cells after inputting new values.
Now, change the format of the rows and columns to make the model easier to interpret. Firstly, unbold the variables and years and change the values to blue to make them easily distinguishable from one another. The completed model should now look like this.
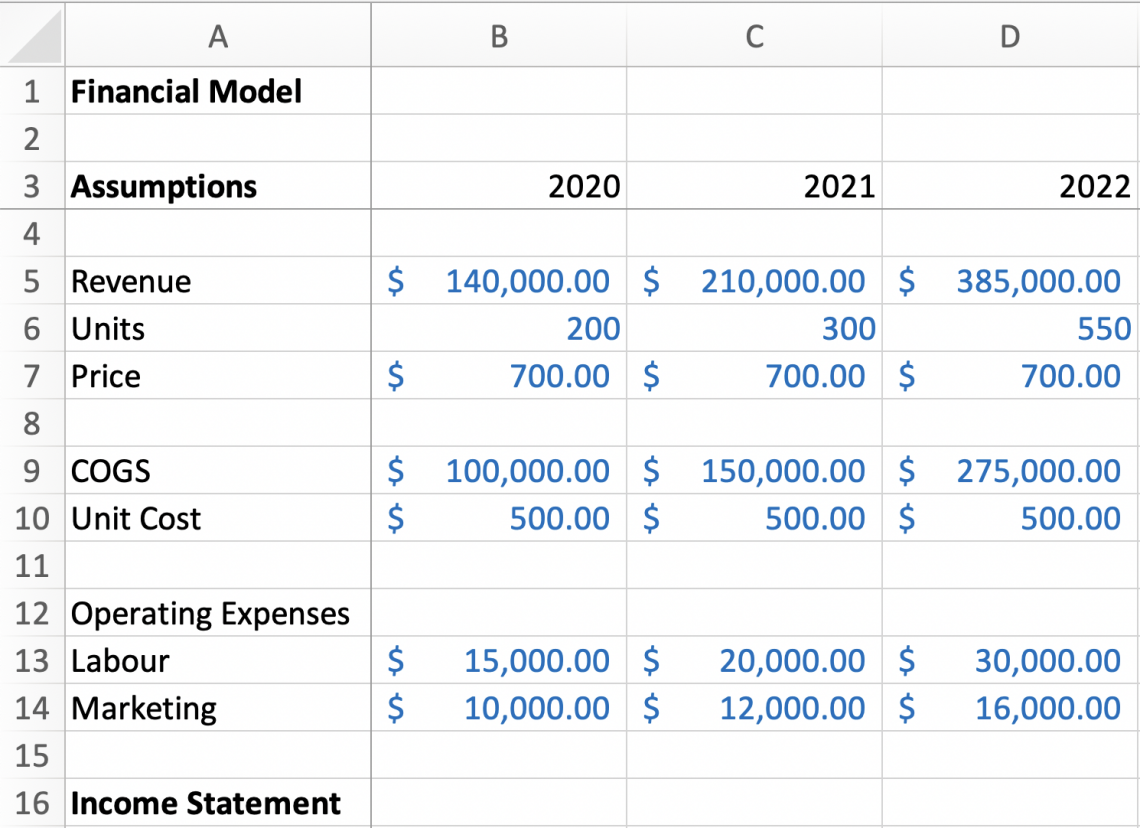
Income Statement
Now, let's incorporate the "Income Statement" into the model and include categories such as "Net Revenue" (which we have already calculated), "COGS," and "Gross Profit. To differentiate the "Assumptions" section from the "Income Statement" using the black font.
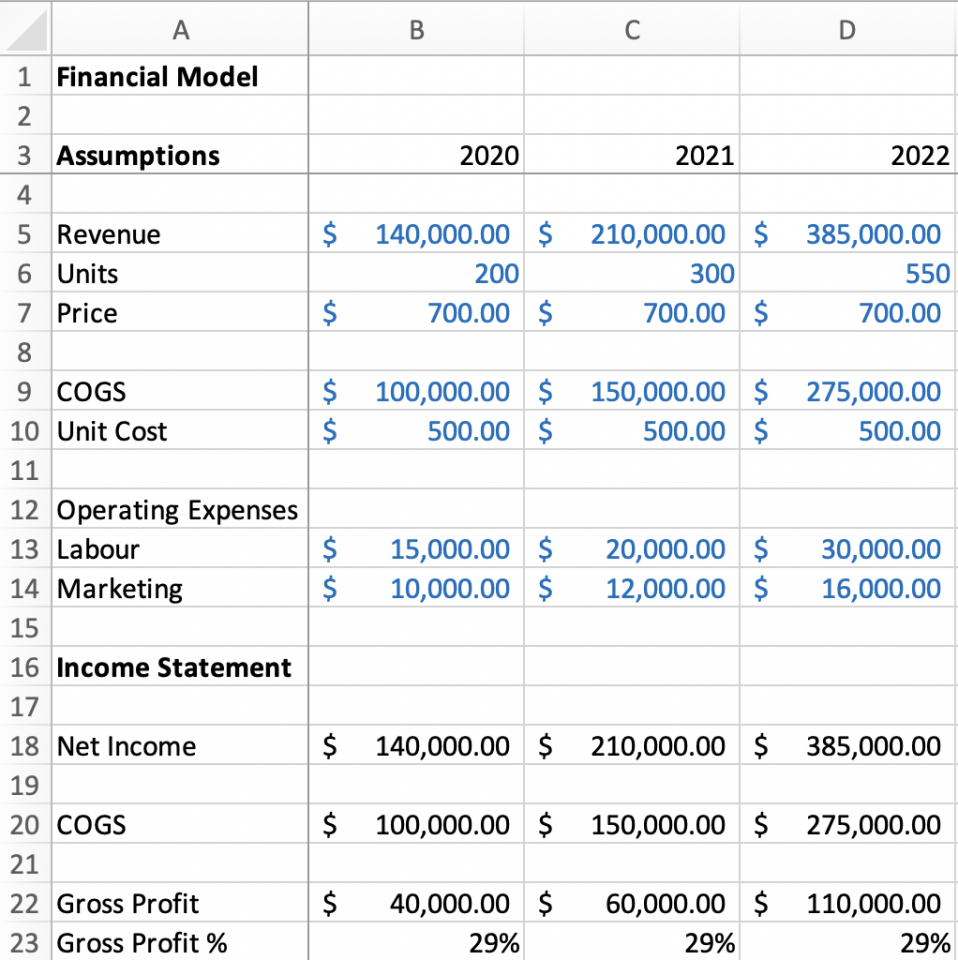
Let us start with "Net Revenue" as we have gone through how to input a formula in the cell to produce this value. First, use the same procedure (=B6*B7) but program into a compartment under the income statement section, then drag the weight across the suitable two cells.
The next category under the Income Statement is "COGS," to calculate this, use the same formula as before (=B10*B6). Again, remember to use the "accounting" format for both "COGS" and "Net Revenue."
To calculate Gross Profit, subtract the value of "COGS" from "Net Revenue" with the formula =B18-B20. To get an idea of these cells, refer to the worksheet below, where you should have progressed by now.
To add another category, "Gross Profit Margins," we can divide "Gross Profit" by "Net Revenue" and convert the value's format to "percentage." You can also adjust the width of the first column to make the titles of the categories more readable, which produces this.
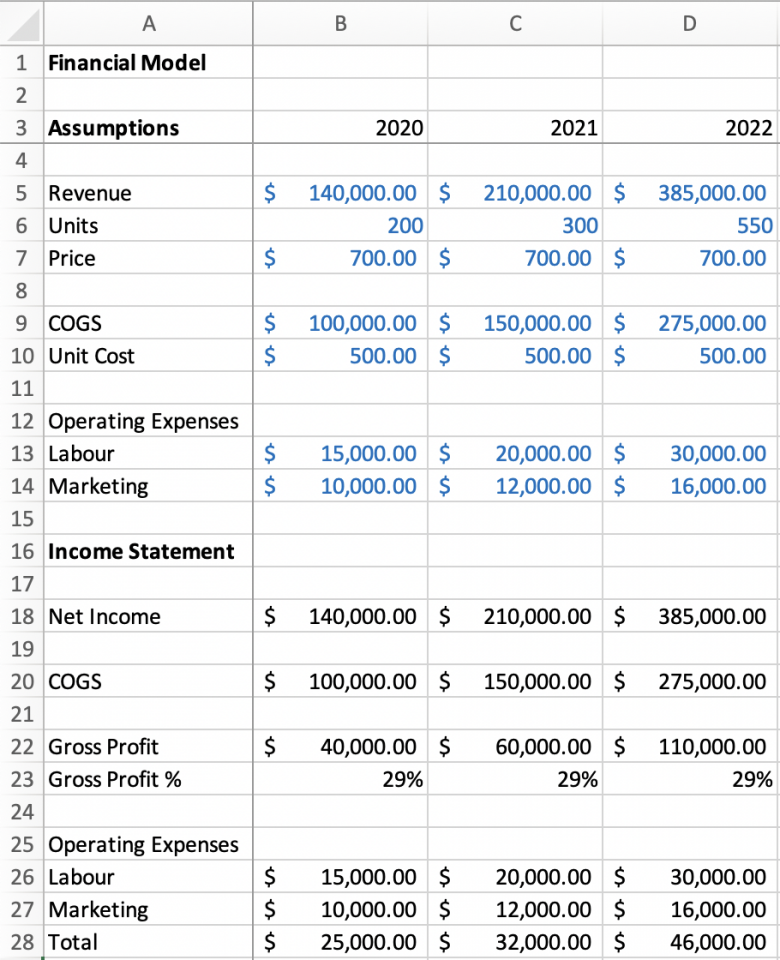
Next, address the "Labor" and "Marketing" Operating Expenses in the Assumptions section. To be efficient, copy and paste the Operating Expenses section to "Income Statement" (with the values for each year) and reformat them.
Then add another category, "Total," underneath "Marketing," and add the two variables with the formula =B13+B14. The Income Statement portion should now look like this.
Next, add two more categories, "Operating Income" and "Operating Margin." The former is calculated by subtracting Total Operating Expenses from "Gross, Profwhilehilst the "Operating Margin" is calculated by dividing "Operating Income" by "Net Revenue."
By now, we have added two new categories. Remember to select the "percentage" format for the margin cells. After doing so, the entire model should look like this.
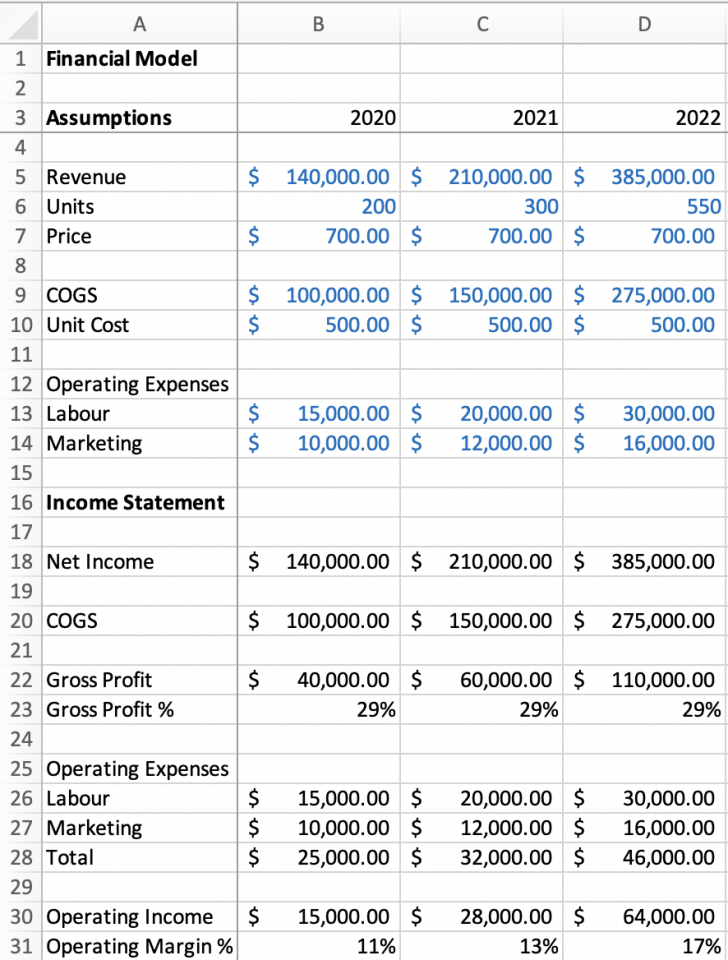
Congratulations! You have just built a model that calculates Gross Profit Margins and Operating Income Margins based on input Assumptions. This model is helpful as it helps business leaders set goals and make strategic decisions.
This is one of many examples of how business investors or managers evaluate a company's current or future performance. To calculate present values, use actual values instead of assumed values to compare the results with the future assumptions model.
Everything You Need To Master Excel Modeling
To Help You Thrive in the Most Prestigious Jobs on Wall Street.

or Want to Sign up with your social account?