
Financial Forecasting
Allows a business to understand where they are currently positioned and where they are headed

Updated:
April 21, 2023Financial forecasting is a process in which estimations regarding a company's future operational and financial performance are derived from various analyses.
What is Financial Forecasting?
Creating a financial forecast allows a business to understand where they are currently positioned and where they are headed. Through projections, a company can ascertain answers from an assortment of questions about the future.
Executives use forecasting to project a variety of important financial measures such as revenue, net income, SG&A, gross profit margin, and net profit margin. In addition, analysis of projections offers management the opportunity to make fundamental operational changes in order to achieve a business's goals.

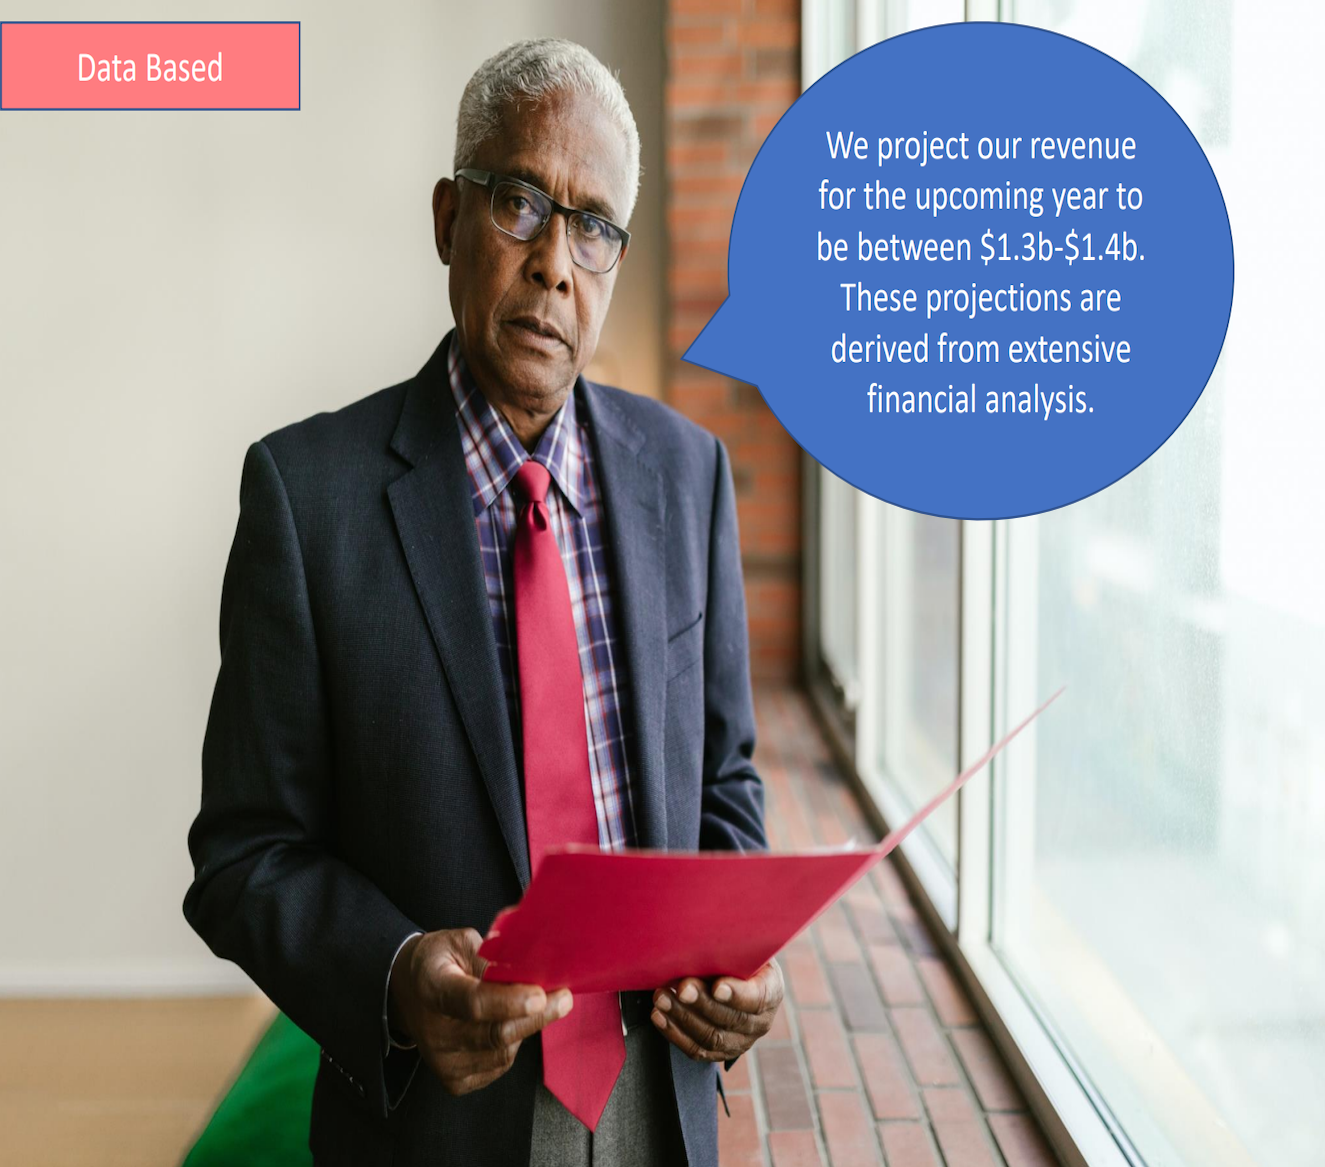
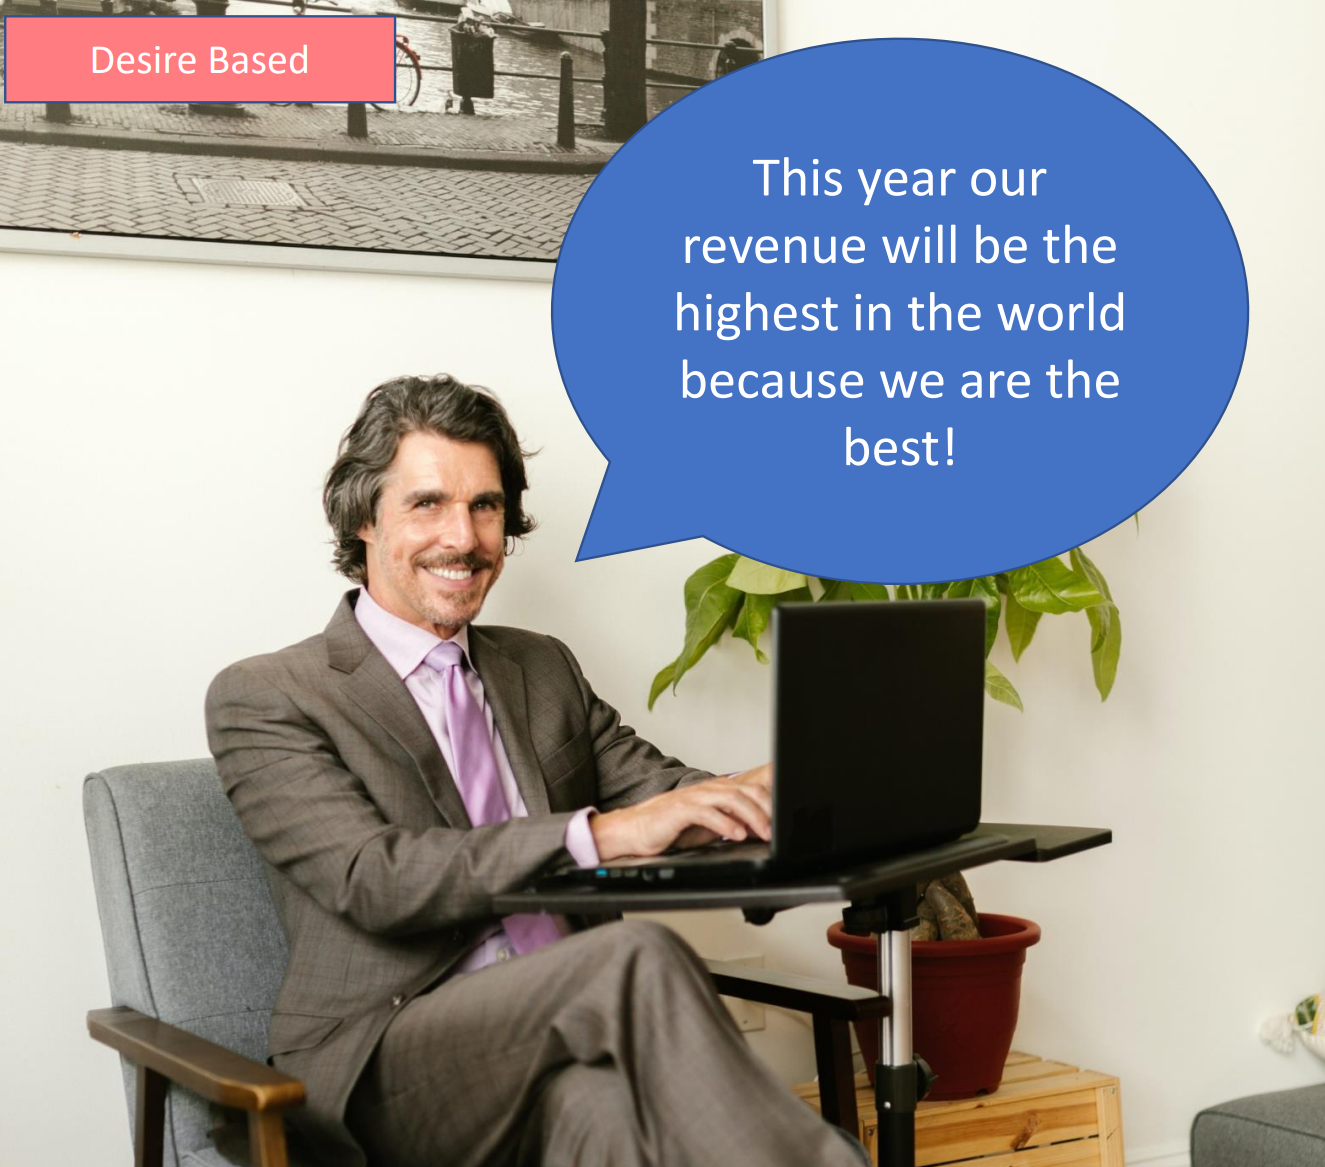
Creating a financial forecast grants companies the ability to derive projections from data opposed to desire. For example, rather than creating a prognosis based on what management wants to happen, which is often based on emotions, a forecast can be created based upon quantitative information bringing about more accuracy, conservatism, and rationality.
A company's forecast can also be a productive medium for communicating expected financials to investors. Analysts can weigh their financial models against a business's forecast to extrapolate a more accurate future share price.
This dynamic creates the opportunity for companies to earn investor trust. For example, if a company has historically provided accurate forecasts, then analysts afford a higher amount of credibility to present-day forecasts. Likewise, if past financial results have missed their mark relative to projections, analysts will deem a company's present-day forecasts to be unreliable.
How to create a financial forecast?
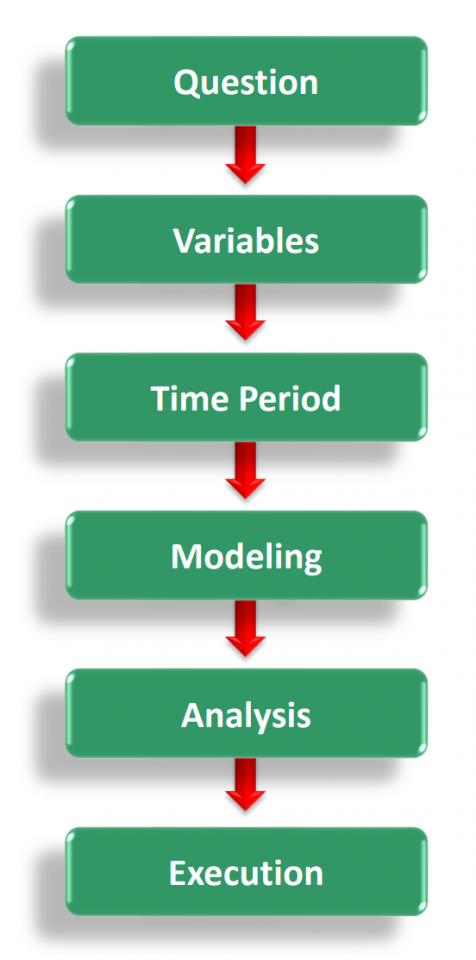
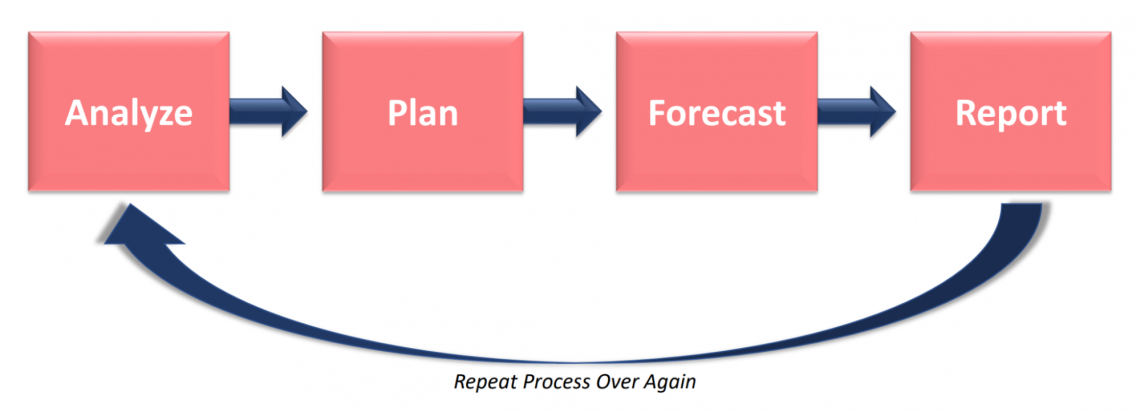
The process for creating a financial forecast consists of 6 steps:
- What is the question?
Prior to analyzing any financial or data, one must know what they are looking for. A question relevant in forecasting maybe, "If we increase R&D by 15% next year, how would that affect net income?" or "If the federal funds rate were to rise to 6%, how would that affect our ability to service our debt payments?" - What are the variables?
Specific data sets and relevant financial information are selected to answer the question posed in step #1. - Select a time period
After choosing what data and financial information are essential for this specific forecast, one must decide what time period to select from this information. Data from 15 years prior may not be relevant anymore, and the same may go for financial results. - Select and create a model
The proper model for analyzing the relevant data is chosen. Forecasts are created using statistical analysis to answer the proposed question in step #1. - Analysis
Once the model has been completed, it is time to analyze the model. In this part of the process, conclusions are derived from the model's output painting a picture of how a company should move forward. - Execution
The forecast is presented to upper management. Management accounts for the projection and implements new policies and procedures to assist the company's trajectory.
Types of forecasting
There are a variety of forecasts that companies can use to project their financial future. Selecting the specific type of forecast is crucial for efficiently and accurately answering any proposed question when it comes to forecasting. The various types of forecasts include traditional, rolling, predictive, and exception-based.
Traditional Forecast:
- Involves using historical financial results and data to create a fixed projection. It produces revised output projections for various financial items such as revenue, cost of goods sold, net income, etc.
- The problem with this type of method is that the projections are fixed. If an unforeseen event occurs, it will be challenging to adjust the model and will often result in the company having to make an entirely new model.
Rolling Forecast:
- It offers a solution to the issue that arises with traditional forecasting. A rolling forecast takes into account new data and financial returns. The model is regularly updated on a time basis set by the company. Depending on company preferences, it may be updated daily, weekly, monthly, or quarterly.
- Allows a company to adjust for unforeseen events without having to make a new model.
- Can improve management decisions by providing a dynamic and regularly updated screenshot of the company's current financial state. Based upon the interpretation of the forecast, management can adapt quickly and implement operational changes.
Predictive Forecast:
- This method uses machine learning to create a forecast. Using artificial intelligence to gather and analyze data, a predictive forecast can provide insights that would have gone unnoticed using the previous forecasting methods.
- It can be less work for employees, and the forecast can be produced on a faster timeline relative to traditional forecasting.
- Predictive models often employ algorithms for data analysis, such as the random forest algorithm, which uses decision trees to observe an item or branch and then output a conclusion which is displayed in the leaves.
- Other algorithms regularly used are the generalized linear model, the gradient boosted model, the prophet model, and the k-means clustering method.
To learn how to implement machine learning within a forecast, look into the following course.
Everything You Need To Master Algo Trading using Python
To Help you Thrive in One of the Most Future Proof Careers on Wall Street.
Exception Based Forecast:
- This method uses scenario analysis to create a forecast that can be adaptable to various potential events. It allows management to identify what the company's financial results may look like under different circumstances.
The selection of a forecasting method is decided at the discretion of a company's management. As a result, some companies may choose to implement multiple forecasting methods, and some may only choose to use one.
As the company gets larger, it will need a higher number of inputs to account for, alongside a higher number of potential hurdles to overcome, all of which need to be recognized within a forecast.
A strong forecast must include a thorough set of data and financial results to draw upon, a time horizon that points toward the future, and a variety of scenarios and their potential effect on company operations. In addition, a strong forecast should account for external and internal risks that have the potential to threaten profitability.
Types of models
There are various models that can be used within a forecast to project and analyze data or financials.
These models are commonly built using Microsoft's Excel software. Using models can increase accuracy by basing projections upon mathematical formulas instead of management desire.
Models that are frequently used for forecasting include:
- The straight-line method.
- The moving average method.
- The linear regression method.
- The Delphi method.
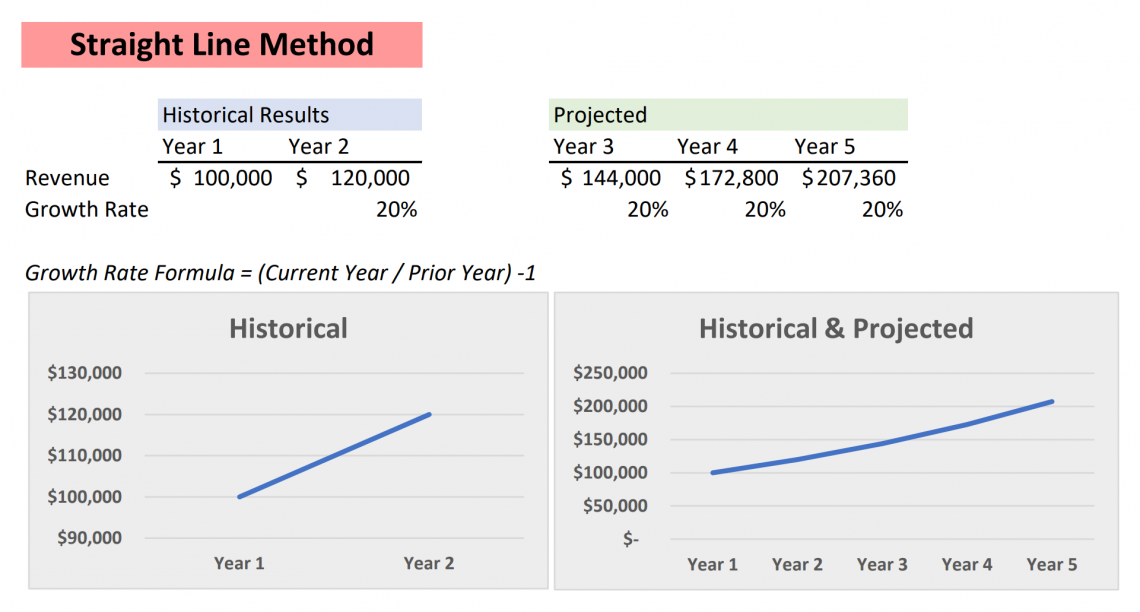
Straight Line Method
- This model takes historical financial results or data and measures the historical growth rate. The growth rate is then used to project the financial results or data into the future to create a forecast. It assumes that past results will continue to be similar in the future.
- The trouble with this model is selecting the proper time period to analyze. It is smart to know what historical data is relevant to the company and what historical data should be discarded.
- To derive the growth rate, take the current year's result, divide it by the prior-year result, and subtract 1. To use the growth rate to project into the future, take the prior-year result and multiply it by 1 plus the growth rate.
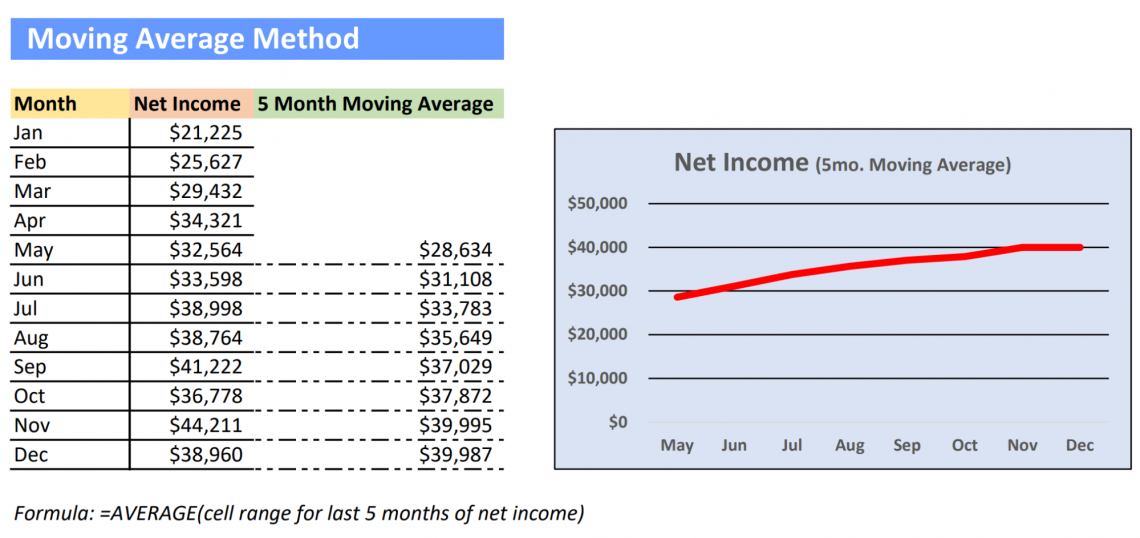
Moving Average Method
- This type of model measures recent patterns in data through averaging results. The model smooths out the volatility of the data points, which allows a company to assess current trends better. Often companies will use 5-month moving averages or 3-month moving averages, although the method can be used on shorter time frames if desired.
- Using the moving average method is to help a company identify trends in key financial measures such as revenue, cost of goods sold, or new subscriptions.
- To derive a 5-month moving average, take the average of a data point over the last 5 months.
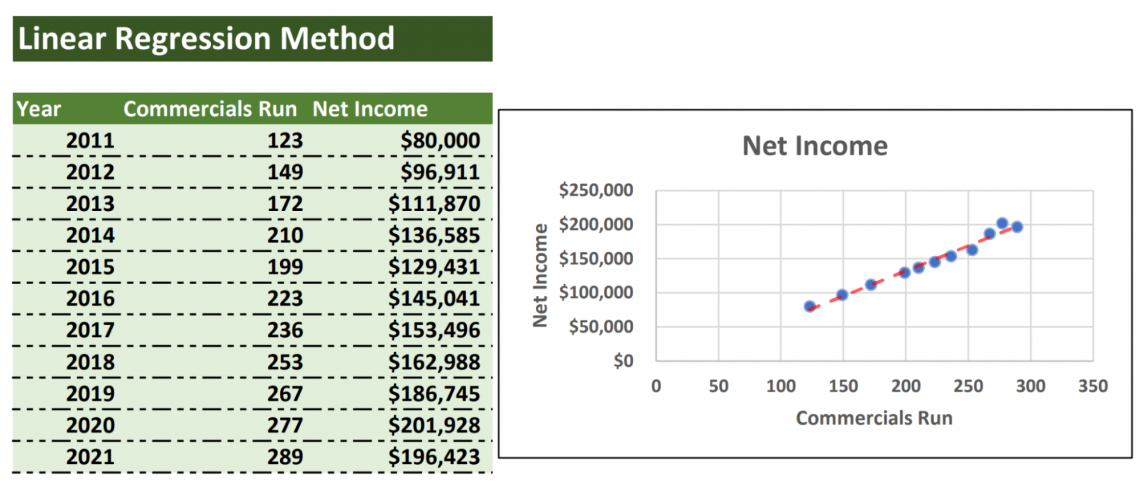
Linear Regression Method
- This type of model creates a visual relationship between two variables. One variable is the dependent variable mapped out on the Y-axis. The other variable is an explanatory variable mapped out on the X-axis. After the data points have been placed onto a graph, a line can be drawn between the points illustrating a pattern or trend.
- This type of analysis allows a company to understand the relationship between multiple financial items.
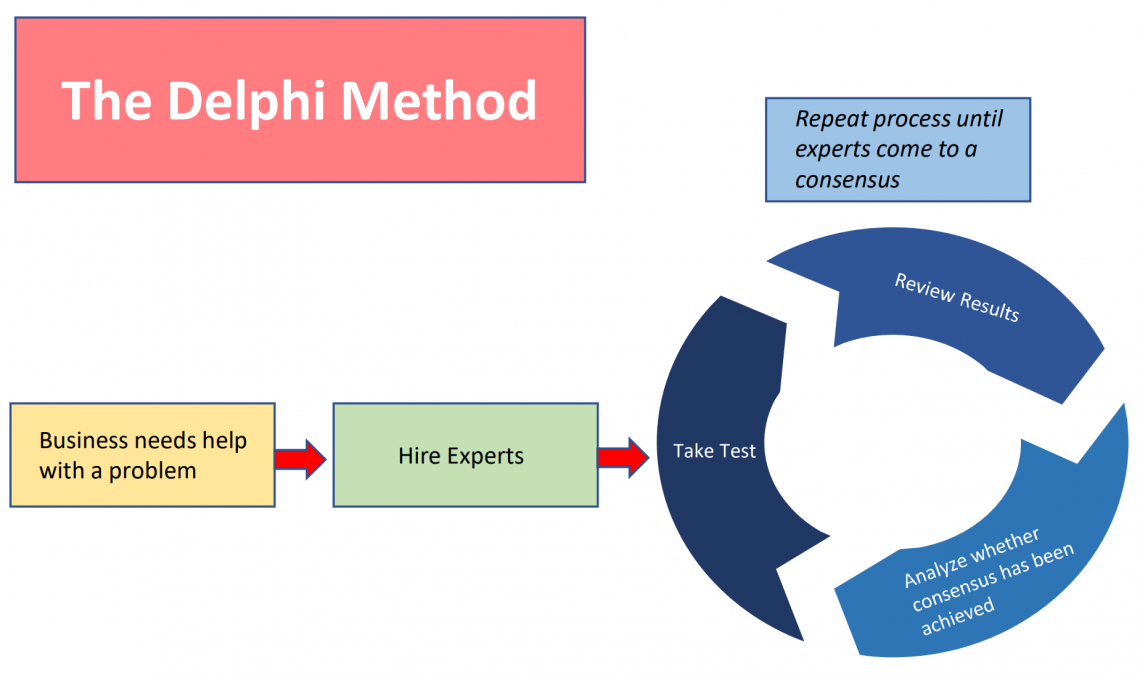
The Delphi Method
- The Delphi method more closely resembles a framework for modeling within the forecasting process opposed to a model created within a spreadsheet. This method does not create a model based upon any mathematical formulas. It creates a model based upon the consensus of opinions.
- It uses a large group of experts to answer a question proposed by a company. The experts take a test and collectively review the answers alongside a moderator. If the experts can agree, then the company has its response. If not, the experts retake the test. This process is repeated until a conclusion is reached.
- The Delphi method is based upon the "wisdom of the crowds" concept, which hypothesizes that people are smarter collectively in larger groups than if they are in smaller groups or on their own individually.
Everything You Need To Master Financial Modeling
To Help you Thrive in the Most Prestigious Jobs on Wall Street.
Forecasting vs. Modeling
An important distinction is a differentiation between forecasting and modeling. While they share many similarities leading many to perceive the two as indistinguishable, in reality, they are quite different.
Below, we look at brief descriptions of the two and the differences between them.
Forecasting
Forecasting is a process. This process consists of projecting business operations into the future so that a company may better prepare for what is to come. This process consists of determining expectations for a given company's outlook going forward. First and foremost, a company must decide what trajectory they prefer the business to be directed toward.
Forecasting can be thought of as a conceptual process that utilizes data analysis and financial analysis to come to a conclusion about that trajectory. While the forecasting process involves modeling as a step, forecasting is not modeling in and of itself.
Modeling
Modeling is a part of the forecasting process in which data analysis and financial analysis occur. Mathematical formulas are applied using data sets, historical financials, and a variety of variables the company would like to take into account.
The types of models that can be deployed are unlimited. However, the most common models deployed by companies are the straight line method, the moving average method, the linear regression method, and the Delphi method.
While the Delphi method does not employ data analysis, it still resembles a model because it can represent useful information in an organized and productive manner. The consensus of the Delphi method is the same as the output within a financial model.
Once this aspect of the forecasting process is finished, the model itself is utilized to assist the management of a company with more accurately forecasting future financial results. Based upon a model's results, a company can begin to make tangible changes to its business operations to produce future results on par with the business's forecast.

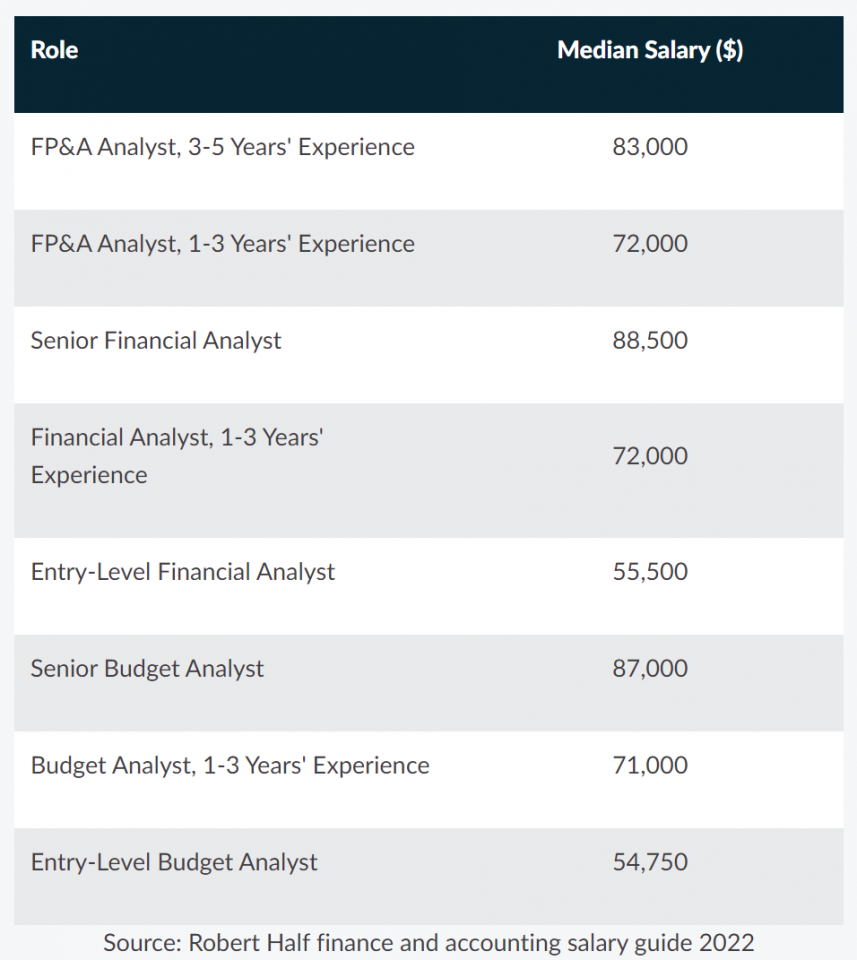
Financial planning and analysis (FP&A)
The Financial Planning and Analysis team (FP&A) is the group that will run financial forecasts the majority of the time within an organization. This team will move through the entire forecasting process and be responsible for effectively communicating the results to the company's executive management.
This dynamic enables executive management to make better decisions and more accurately inform investors and shareholders about company operations and financial results.
The primary responsibilities of the FP&A team are:
- Create forecasts and budgets
- Inform senior management, in particular, the chief financial officer (CFO)
- Analyze historical financial returns
- Utilize data analysis to make informed decisions
- Account for potential risks that pose a threat to the company's financial health
The FP&A team will analyze data and financials to create successful budgets and forecasts. For example, suppose a company has chosen to implement rolling forecasts within their organization. In that case, they are responsible for monitoring results and editing financial models to keep them up to date.
Oftentimes, the company's management will develop a plan for the direction they would like to take the company in. This direction includes future financial results based upon key items such as revenue, net income, and share price.
It is the FP&A team's job to properly digest this plan and create forecasts and budgets that accurately align with management's goals. The FP&A team will dictate in their analysis how business' operations need to change for the executive's objectives to be accomplished.
The most crucial aspect of working within FP&A is an analyst's ability to communicate effectively. It is not enough to have a fantastic financial model, but the analyst must be able to convey information to the senior management productively. The goal is to use the data to tell a story. This format allows quantitative findings to be efficiently digested, leading to a higher chance of implementing operational changes.
Problems with forecasting
Many of the issues inherent in forecasting derive from two unfortunate truths.

1. The first truth is that the future is unknown
- Forecasts portray a picture of the future. While the inputs within a financial model may be accurate, there is no way to be 100% sure about future results.
- There is a slippery slope towards using forecasts as an idea or a projection about what is likely to happen and using forecasts as a concrete representation of what will happen.
- Specifically, when using the straight-line method or the moving average method to project financial results, there is no guarantee that the past financial results of a company will continue to be the same in the future.
2. The second truth is that forecasting involves a large amount of subjectivity
- The formula an analyst selects for projecting a specific financial item can cause varying results. How the growth rate is derived, whether it is from past performance or another metric, is, in its nature, a subjective decision.
- In addition, the operational changes that are implemented by management are based on subjective interpretation of the forecast's results.
3. Below are a few additional issues that arise when forecasting
- Black swan events are major occurrences that are unforeseen or unexpected. Good examples were the global financial crisis of the late 2000s and covid-19 in 2020. A forecast can't account for an unexpected event, which causes every forecast to carry a certain degree of potential error inherently.
- The Delphi method allows companies to acquire valuable and accurate information from experts on a selected topic. Without the experts, a company may not be able to derive an accurate understanding of a particular subject matter.
- The trouble with this method is the underlying assumption based on the wisdom of the crowd theory. The theory hypothesizes that people are smarter collectively than as individuals.
- We can credit almost all of history's greatest scientific achievements to a group of people who were able to work together and, via collaboration, increase productivity and success.
- It is wise to be aware that this is not always the case. We can point to tulip mania in the 17th century, fascism in the 20th century, and the dot com bubble of the late 1990s as examples of the dangers that can arise from groupthink.
Everything You Need To Master Financial Statement Modeling
To Help you Thrive in the Most Prestigious Jobs on Wall Street.
More about financial modeling
To continue learning and advancing your career, check out these additional helpful WSO resources:

or Want to Sign up with your social account?