
% Difference Formula
Helps find the percentage change between two numbers, where either can be used as the base number

Updated:
August 8, 2022Percentage difference helps find the percentage change between two numbers, where either can be used as the base number.

By calculating the percentage difference between, for example, stock prices, you can precisely describe how the data has changed over time.
Percentage difference - What is it?
Let's say we have two numbers, a and b, where a is the base number and b is the new number. So we will break down the term percentage difference into two parts - 'percentage' and 'difference.'
We will first subtract the new number from the base number, i.e., b - a, thus finding the difference.
Our second step is finding the percentage. It's pretty easy to determine that we will multiply our mathematical expression by 100 but wait! The percentage difference is supposed to give the change between two numbers or the base number, in our case.
So, our final expression to calculate the percentage difference becomes (b - a)/a, which is then multiplied by 100.

Formula
The formula that you can use to calculate the percentage difference between two numbers is:
% difference = ((Number 2 - Number 1) / Number 1) *100
where,
Number 1 = base number
Number 2 = new number
Even number 2 can be the base number in the formula. The output will differ depending on what you use as the base number. Also, the base number can be either smaller or larger than the new number while finding the % difference.
Examples
It is a versatile formula. You can use it in different scenarios to analyze the change in data over a certain period. Some examples of the formula are:
Example #1
Assume that a store used to sell a pack of candy for $1.20 in 2021. However, due to excessive inflation in 2022, the store updated the price to $1.45. The percentage change in one year for the price of a pack of candy is:
= ((1.45 - 1.20) / 1.20) * 100
= (0.25 / 1.20) * 100 = 0.2083 * 100
= 20.83 %
Thus, the candy pack price changed by 20.83% in just one year. What If the price increases again in 2023 to $1.90? The percentage change for one year from 2022 to 2023 will then be:
= ((1.90 - 1.45) / 1.45) * 100
= (0.45 / 1.45) * 100 = 0.3103 * 100
= 31.03 %
The price for a pack of candy will change by 31.03%. However, finding the % difference isn't just limited to one year. To find the % change from 2021, before the rise in inflation, up to our expected price rise in 2023, the calculations will be:
= ((1.90 - 1.20) / 1.20) * 100
= (0.70 / 1.20) * 100 = 0.5833 * 100
= 58.33 %
Based on our calculations, the candy pack price will rise by 58.33% in two years!
Example #2
As much as Covid- 19 had made investors lose money, the consequent rally in stocks that followed returned more than twice the losses for some.
Suppose, as a financial analyst; you need to determine the % return on FAANG stocks since the rally that succeeded the sharp fall in stock prices.
We will assume that the rally for FAANG stocks began on the 20th of March, 2020, considering some buffer time. Therefore, the stock prices as of close on the 20th of March, 2020, and the 18th of March, 2022, are shown in the table below:
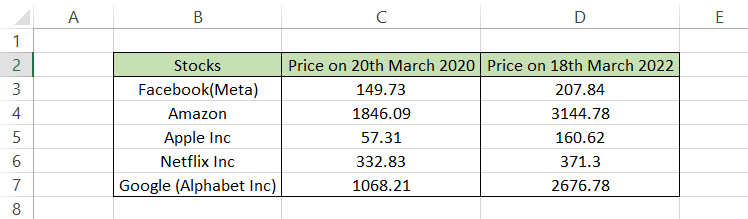
To find the % return in excel, you will use the formula =((D3-C3)/C3)*100 in cell E3 and drag it up to cell E7. The result that you will get in the spreadsheet is as illustrated below:
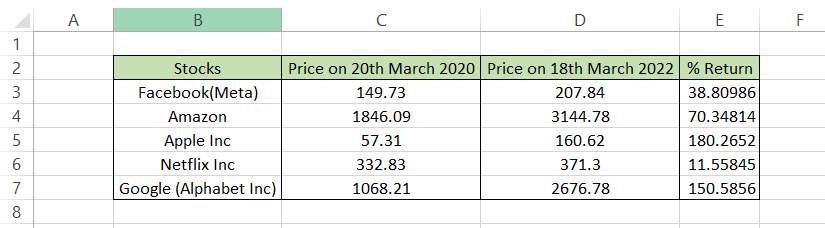
There might have been ups and downs, crazy crashes due to earnings releases (Facebook), or other factors affecting the market, but those are pretty good returns in just two years.
Example #3
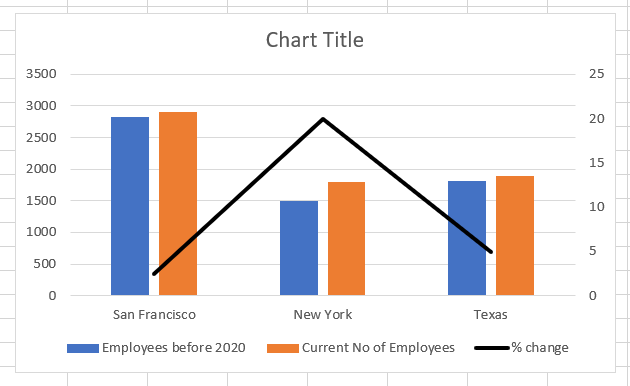
Assume that you are working in HR for XYZ company. Since Covid-19, your company has aggressively hired new employees. The number of employees in each of the three company offices before 2020 and as of 2022 is below:
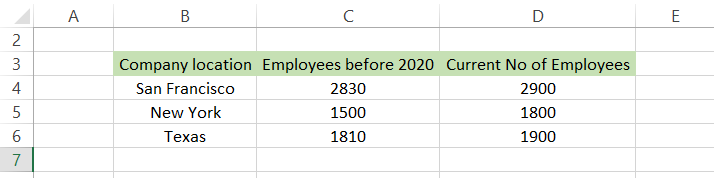
To find the % change in the number of employees, the formula that you will use is =((D4-C4)/C4)*100 to give you the result as illustrated below:
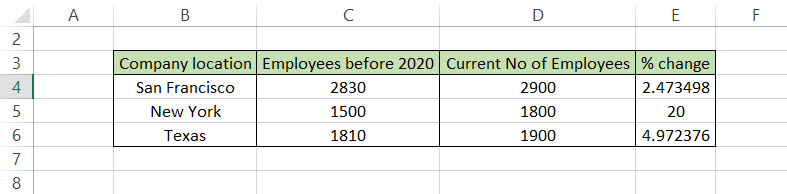
The employees in the San Francisco office rose by 2.47%, the Texas office employee count rose by 4.97%, while the most employees were hired at the New York office, where the number of employees increased by 20% from its count in 2020.
You can also add charts to compare the employee counts and the % change by plotting a secondary axis and a combo chart in Excel.
To read more on how you can add a secondary axis in Excel, check out our article on Secondary Axis.
- The percentage difference represents the difference between two values in terms of a percentage, where either value can be used as the base value.
- Finding the difference between the numbers, followed by dividing the result with the base number, will give you the % difference in decimals. You must multiply it by one hundred to change it to a percentage.
- A positive value indicates growth, whereas a negative value indicates shrinkage.
- You can use the ROUND function outside the formula, such as =ROUND(((D4-C4)/C4)*100), 2) to limit the recurring decimal numbers, with the second parameter determining the number of decimal points used.
- The % difference helps us understand the change between two values over time and the difference at a single point in time.

Everything You Need To Master Excel Modeling
To Help You Thrive in the Most Prestigious Jobs on Wall Street.

or Want to Sign up with your social account?