
Charts And Figures Template
Present your numbers using charts and figures

Updated:
January 31, 2022Download WSO's free Charts & Figures PowerPoint template below!
This template allows you to showcase some of your financial numbers with graphs and charts.
The template is plug-and-play, and you can enter your own text or numbers. The template also includes other slide pages for other elements of a financial model presentation. According to the WSO Dictionary,
"Charts, figures, and graphics are typically used to present raw data, not when you want to show a relationship between variables."
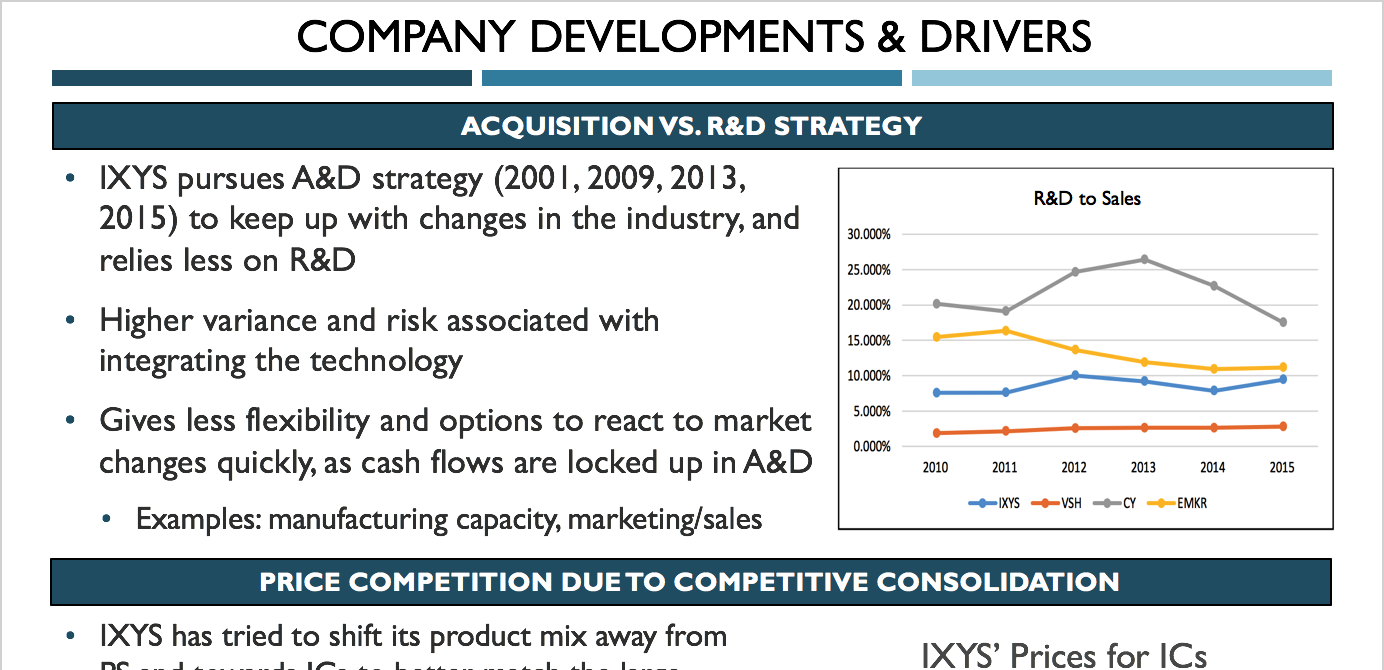
A screenshot below gives you a sneak peek of the template.

Everything You Need To Break into Investment Banking
Sign Up to The Insider's Guide on How to Land the Most Prestigious Jobs on Wall Street.
More Resources:
We hope this template helps you excel at your job! Please check out the following additional resources to help you advance your career:

or Want to Sign up with your social account?